
使用 OpenTelemetry Collector 蒐集 Spring Boot 應用數據
這篇文章記錄如何透過 opentelemetry-collector 蒐集 Spring Boot 應用程式產生的監控數據,並將應用程式端送出的 traces、metrics 與 logs 統一交由 OpenTelemetry Collector 接收與處理。
OpenTelemetry Collector 在整個流程中扮演中介層的角色。Spring Boot 應用程式會透過 OTLP 將資料送到 Collector,Collector 再依照設定把不同類型的 telemetry data 分別交給對應的 exporter。這樣可以讓應用程式端維持一致的輸出方式,後續若要更換監控後端,也能集中調整 Collector 設定。
本文會依序完成以下設定:
- 安裝 OpenTelemetry Collector
- 修改 Collector 設定檔
- 設定 Collector 接收 OTLP 資料並輸出 Prometheus metrics
- 在 Spring Boot 專案中加入 OpenTelemetry 相關依賴
- 設定 Spring Boot 將資料送到 Collector
安裝 OpenTelemetry Collector
首先在 Linux 環境中安裝 OpenTelemetry Collector。這裡使用官方提供的 RPM 套件進行安裝:
官方安裝文件可以參考:Install the Collector - Linux binary
1 | sudo apt-get update |
安裝完成後,系統會建立 otelcol 相關執行檔與預設設定檔。接下來需要調整 Collector 的設定,讓它能夠接收 Spring Boot 應用程式送出的 OTLP 資料。
修改設定
OpenTelemetry Collector 的設定檔位於以下路徑:
/etc/otelcol/config.yaml
這個設定檔會定義 Collector 要啟用哪些 receiver、processor、exporter,以及 service pipeline 要如何串接這些元件。
參考設定
以下是一份可用於接收 Spring Boot OTLP 資料的 Collector 參考設定:
1 | # To limit exposure to denial of service attacks, change the host in endpoints below from 0.0.0.0 to a specific network interface. |
這份設定主要包含三個部分:
receivers:透過otlp接收 Spring Boot 應用程式送出的資料,並透過prometheus收集 Collector 本身的 metricsprocessors:使用batch將資料批次處理後再送出exporters:使用debug輸出詳細資料,並透過prometheusexporter 暴露 metrics
其中 otlp receiver 同時啟用了 gRPC 與 HTTP 兩種協定。gRPC 會使用 4317 port,HTTP 則會使用 4318 port。後續 Spring Boot 端會透過 OTLP HTTP endpoint 將資料送到 Collector。
service.pipelines 則定義 traces、metrics 與 logs 三種資料流程。Spring Boot 送出的資料會先進入 otlp receiver,接著經過 batch processor,最後再交給對應的 exporter 處理。
設置 Spring Boot
Collector 設定完成後,接著要調整 Spring Boot 專案,讓應用程式能夠產生 OpenTelemetry 資料並送到 Collector。
引入依賴
在 Spring Boot 專案中加入 Actuator 與 OpenTelemetry 相關依賴:
1 | <dependency> |
spring-boot-starter-actuator 用來提供 Spring Boot 的管理與監控能力,spring-boot-starter-opentelemetry 則讓應用程式可以整合 OpenTelemetry,並透過 OTLP 將資料輸出到 Collector。
添加設定
接著在 Spring Boot 設定檔中加入 OTLP exporter 相關設定:
1 | # OTLP metrics export is disabled by default for local development. |
這段設定會將 Spring Boot 的 OTLP endpoint 指向 http://127.0.0.1:4318。如果 Spring Boot 與 Collector 部署在不同主機,則可以透過 OTEL_EXPORTER_OTLP_ENDPOINT 環境變數覆寫預設值。
management.opentelemetry.resource-attributes.service.name 會使用 Spring Boot 的應用程式名稱作為服務名稱,方便後續在監控資料中識別資料來源。management.opentelemetry.resource-attributes.deployment.environment 則用來標記目前部署環境,這裡設定為 dev。
otel.metric.export.interval 代表 metrics 匯出的間隔,otel.exporter.otlp.timeout 則是 OTLP exporter 傳送資料時的逾時設定。設定完成後,Spring Boot 應用程式就會依照這些參數將資料送往 OpenTelemetry Collector。
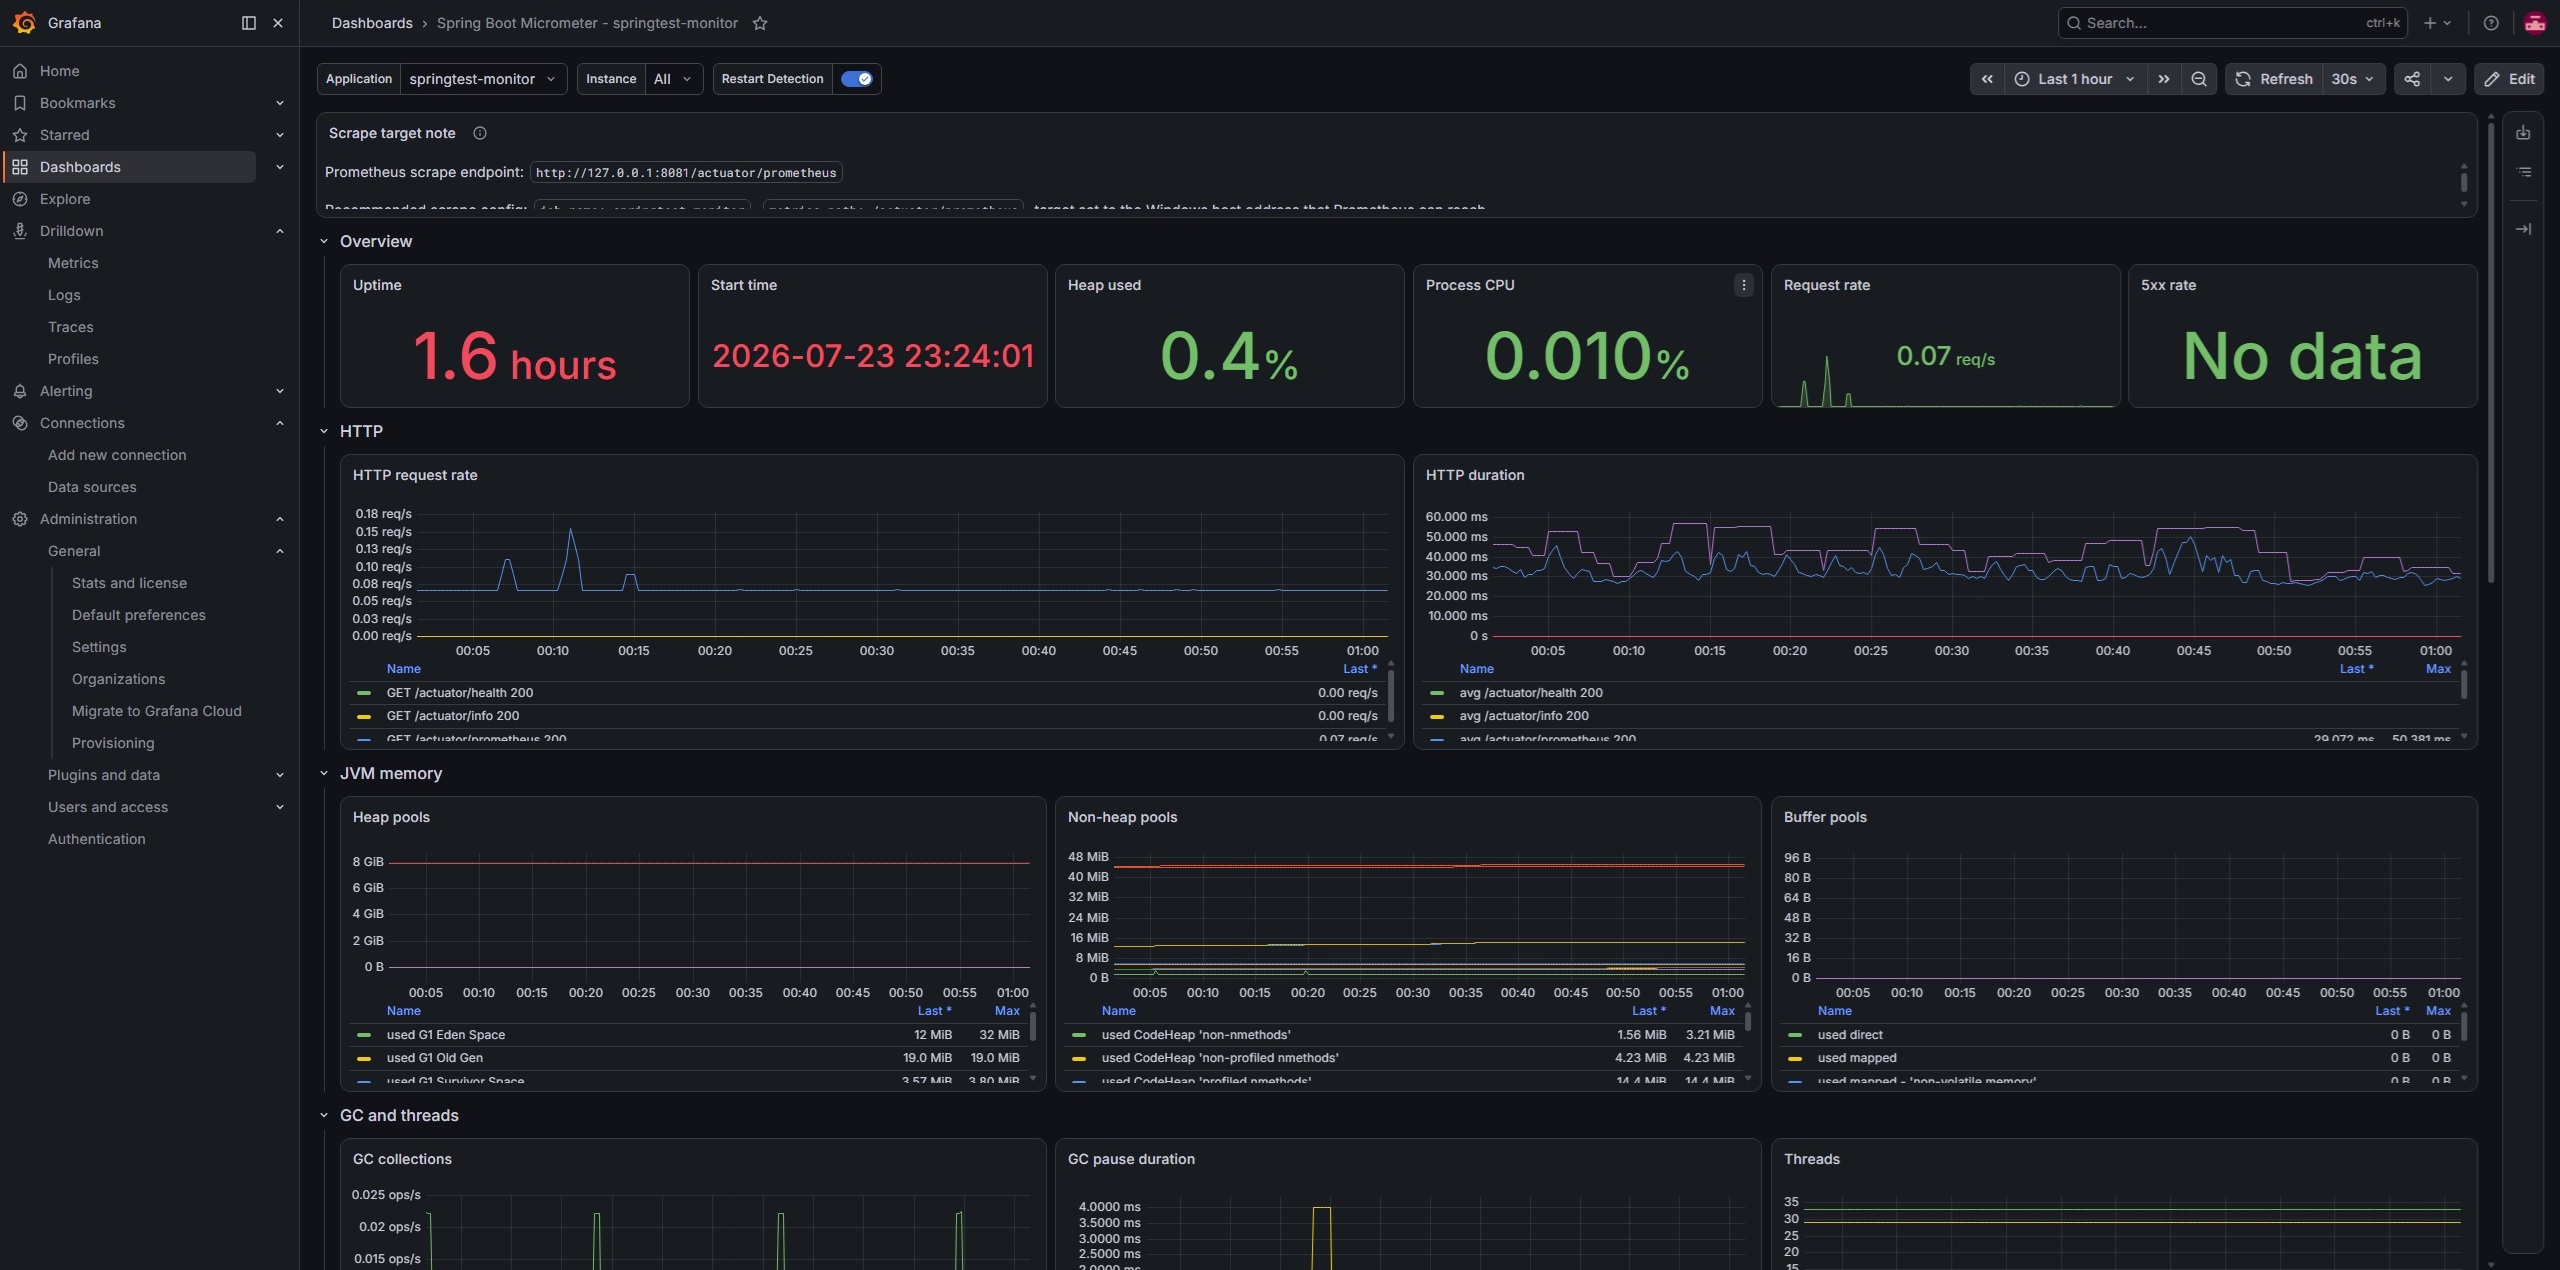
完成設定並接上監控後,可以在 Grafana dashboard 中觀察 Spring Boot 應用程式的 metrics 資料。
小結
透過 OpenTelemetry Collector,可以將 Spring Boot 應用程式產生的 traces、metrics 與 logs 統一交由 Collector 接收,再透過 pipeline 分別處理與輸出。這種做法可以降低應用程式與監控後端之間的耦合,也讓後續調整 exporter 或資料處理流程時更加集中。
本文完成了 Collector 安裝、Collector 設定,以及 Spring Boot 端的依賴與 OTLP exporter 設定。完成這些步驟後,Spring Boot 應用程式就能將 telemetry data 送到 OpenTelemetry Collector,並由 Collector 依照設定輸出 debug 資訊與 Prometheus metrics。