
使用 Prometheus 監控 Spring Boot 應用程式
這篇文章記錄如何在 Spring Boot 應用程式中加入 micrometer-registry-prometheus,並透過 Spring Boot Actuator 暴露 Prometheus 可以抓取的 Metrics endpoint。
Grafana 與 Prometheus 的安裝流程已經在前一篇文章介紹過,因此本文會專注在 Spring Boot 與 Prometheus 之間的設定:Spring Boot 要如何產生監控指標、Prometheus 要如何抓取這些指標,以及設定完成後要如何確認資料是否正常。
整體架構
在這個監控流程中,Spring Boot 應用程式本身不會主動把資料推送到 Prometheus,而是透過 Actuator 開放 /actuator/prometheus endpoint。Prometheus 會依照設定的間隔定期呼叫這個 endpoint,將應用程式的 Metrics 抓回來儲存。
整體流程如下:
- Spring Boot 加入 Actuator 與 Prometheus Registry 相依套件
- Spring Boot 開放
/actuator/prometheusendpoint - Prometheus 設定 scrape target,定期抓取 Spring Boot Metrics
- 在 Prometheus Web UI 確認 target 狀態與查詢 Metrics
- Grafana 透過 Prometheus 資料來源建立 Dashboard
本文會聚焦在前四個步驟,Grafana Dashboard 的操作不會在這篇文章中展開。
Spring Boot 加入監控相依套件
首先在 Spring Boot 專案中加入 spring-boot-starter-actuator 與 micrometer-registry-prometheus。
spring-boot-starter-actuator 用來提供應用程式健康狀態、Metrics、環境資訊等管理 endpoint;micrometer-registry-prometheus 則會把 Micrometer 收集到的 Metrics 轉換成 Prometheus 可以讀取的格式。
如果專案使用 Maven,可以在 pom.xml 中加入以下相依套件:
1 | <dependencies> |
如果專案使用 Gradle,可以加入以下設定:
1 | dependencies { |
加入相依套件後,Spring Boot 啟動時會自動建立 Prometheus Meter Registry,並準備好 Prometheus 格式的 Metrics 輸出能力。
開放 Prometheus Endpoint
Actuator 預設不會把所有 endpoint 都暴露在 HTTP 上,因此需要在 application.yml 中設定要開放的 endpoint。
以下設定會開放 health、info 與 prometheus,並將應用程式名稱加到 Metrics 標籤中:
1 | spring: |
這裡的重點是 management.endpoints.web.exposure.include 必須包含 prometheus,這樣 Spring Boot 才會對外提供 /actuator/prometheus。
management.endpoint.health.probes.enabled 會額外啟用 liveness 與 readiness probe,方便在 Kubernetes 或其他平台中檢查應用程式狀態。management.prometheus.metrics.export.enabled 則明確啟用 Prometheus metrics export。management.metrics.tags.application 則是替所有 Metrics 加上一個固定的 application 標籤。這裡使用 ${spring.application.name},讓標籤值跟 Spring Boot 應用程式名稱保持一致。當 Prometheus 同時監控多個 Spring Boot 應用程式時,這個標籤可以用來區分資料來源。
如果專案使用 application.properties,可以改成以下寫法:
1 | spring.application.name=spring-boot-demo |
設定完成後,重新啟動 Spring Boot 應用程式,並開啟以下網址確認 endpoint 是否正常:
1 | http://localhost:8080/actuator/prometheus |
如果設定正確,畫面上會看到 Prometheus text format 的資料,例如:
1 | # HELP jvm_memory_used_bytes The amount of used memory |
看到類似上述內容,就代表 Spring Boot 已經成功輸出 Prometheus 可以抓取的 Metrics。
調整 Management Port
預設情況下,Actuator endpoint 會與應用程式使用相同 port。例如應用程式跑在 8080,Prometheus endpoint 就會是 http://localhost:8080/actuator/prometheus。
如果希望管理用 endpoint 與一般 API 分開,也可以另外指定 management port:
1 | server: |
調整後,Prometheus 要抓取的網址會變成:
1 | http://localhost:8081/actuator/prometheus |
這種做法適合在正式環境中將應用程式流量與監控流量分開管理,也比較方便針對 management port 設定防火牆或內部網路存取規則。
設定 Prometheus Scrape Target
Spring Boot 端完成設定後,接著要修改 Prometheus 設定檔,讓 Prometheus 定期抓取 /actuator/prometheus。
開啟 Prometheus 設定檔:
1 | sudo nano /etc/prometheus/prometheus.yml |
在 scrape_configs 中加入 Spring Boot 應用程式的 target:
1 | scrape_configs: |
如果前面有另外設定 management.server.port: 8081,這裡的 target 就要改成 localhost:8081:
1 | - job_name: "spring-boot-demo" |
這段設定中有幾個重點:
job_name是 Prometheus 中用來識別這組監控任務的名稱metrics_path要對應 Spring Boot 暴露的 Prometheus endpointscrape_interval代表 Prometheus 抓取資料的間隔targets是 Spring Boot 應用程式所在的主機與 port
如果 Prometheus 與 Spring Boot 執行在不同機器,targets 不能使用 localhost,必須改成 Spring Boot 所在機器的 IP 或網域名稱。例如:
1 | - job_name: "spring-boot-demo" |
修改完成後,重新啟動 Prometheus:
1 | sudo systemctl restart prometheus |
確認 Prometheus 狀態是否正常:
1 | sudo systemctl status prometheus |
在 Prometheus 確認 Target 狀態
Prometheus 重新啟動後,開啟瀏覽器進入 Prometheus Web UI:
1 | http://localhost:9090 |
接著進入 Status -> Targets,確認 spring-boot-demo 這個 job 是否出現在列表中。
如果狀態顯示為 UP,代表 Prometheus 已經可以成功連線到 Spring Boot 的 /actuator/prometheus endpoint。
如果狀態顯示為 DOWN,可以先檢查以下幾個項目:
- Spring Boot 應用程式是否正在執行
/actuator/prometheus是否可以直接透過瀏覽器或 curl 開啟- Prometheus 設定中的
targets是否使用正確 IP 與 port - 如果有設定
management.server.port,Prometheus 是否抓取到正確的 management port - 防火牆或容器網路是否允許 Prometheus 連線到 Spring Boot
也可以直接使用 curl 測試 Spring Boot 是否有正常輸出 Metrics:
1 | curl http://localhost:8080/actuator/prometheus |
查詢 Spring Boot Metrics
Target 狀態變成 UP 後,就可以在 Prometheus Web UI 的查詢頁面測試 Metrics。
例如查詢 JVM 記憶體使用量:
1 | jvm_memory_used_bytes |
查詢 HTTP request 次數:
1 | http_server_requests_seconds_count |
查詢指定應用程式的 HTTP request 次數:
1 | http_server_requests_seconds_count{application="spring-boot-demo"} |
如果應用程式有收到 HTTP request,通常可以看到 uri、method、status、exception、outcome 等標籤,這些資料後續就可以在 Grafana 中用來建立 API 請求量、錯誤率與延遲時間相關的圖表。
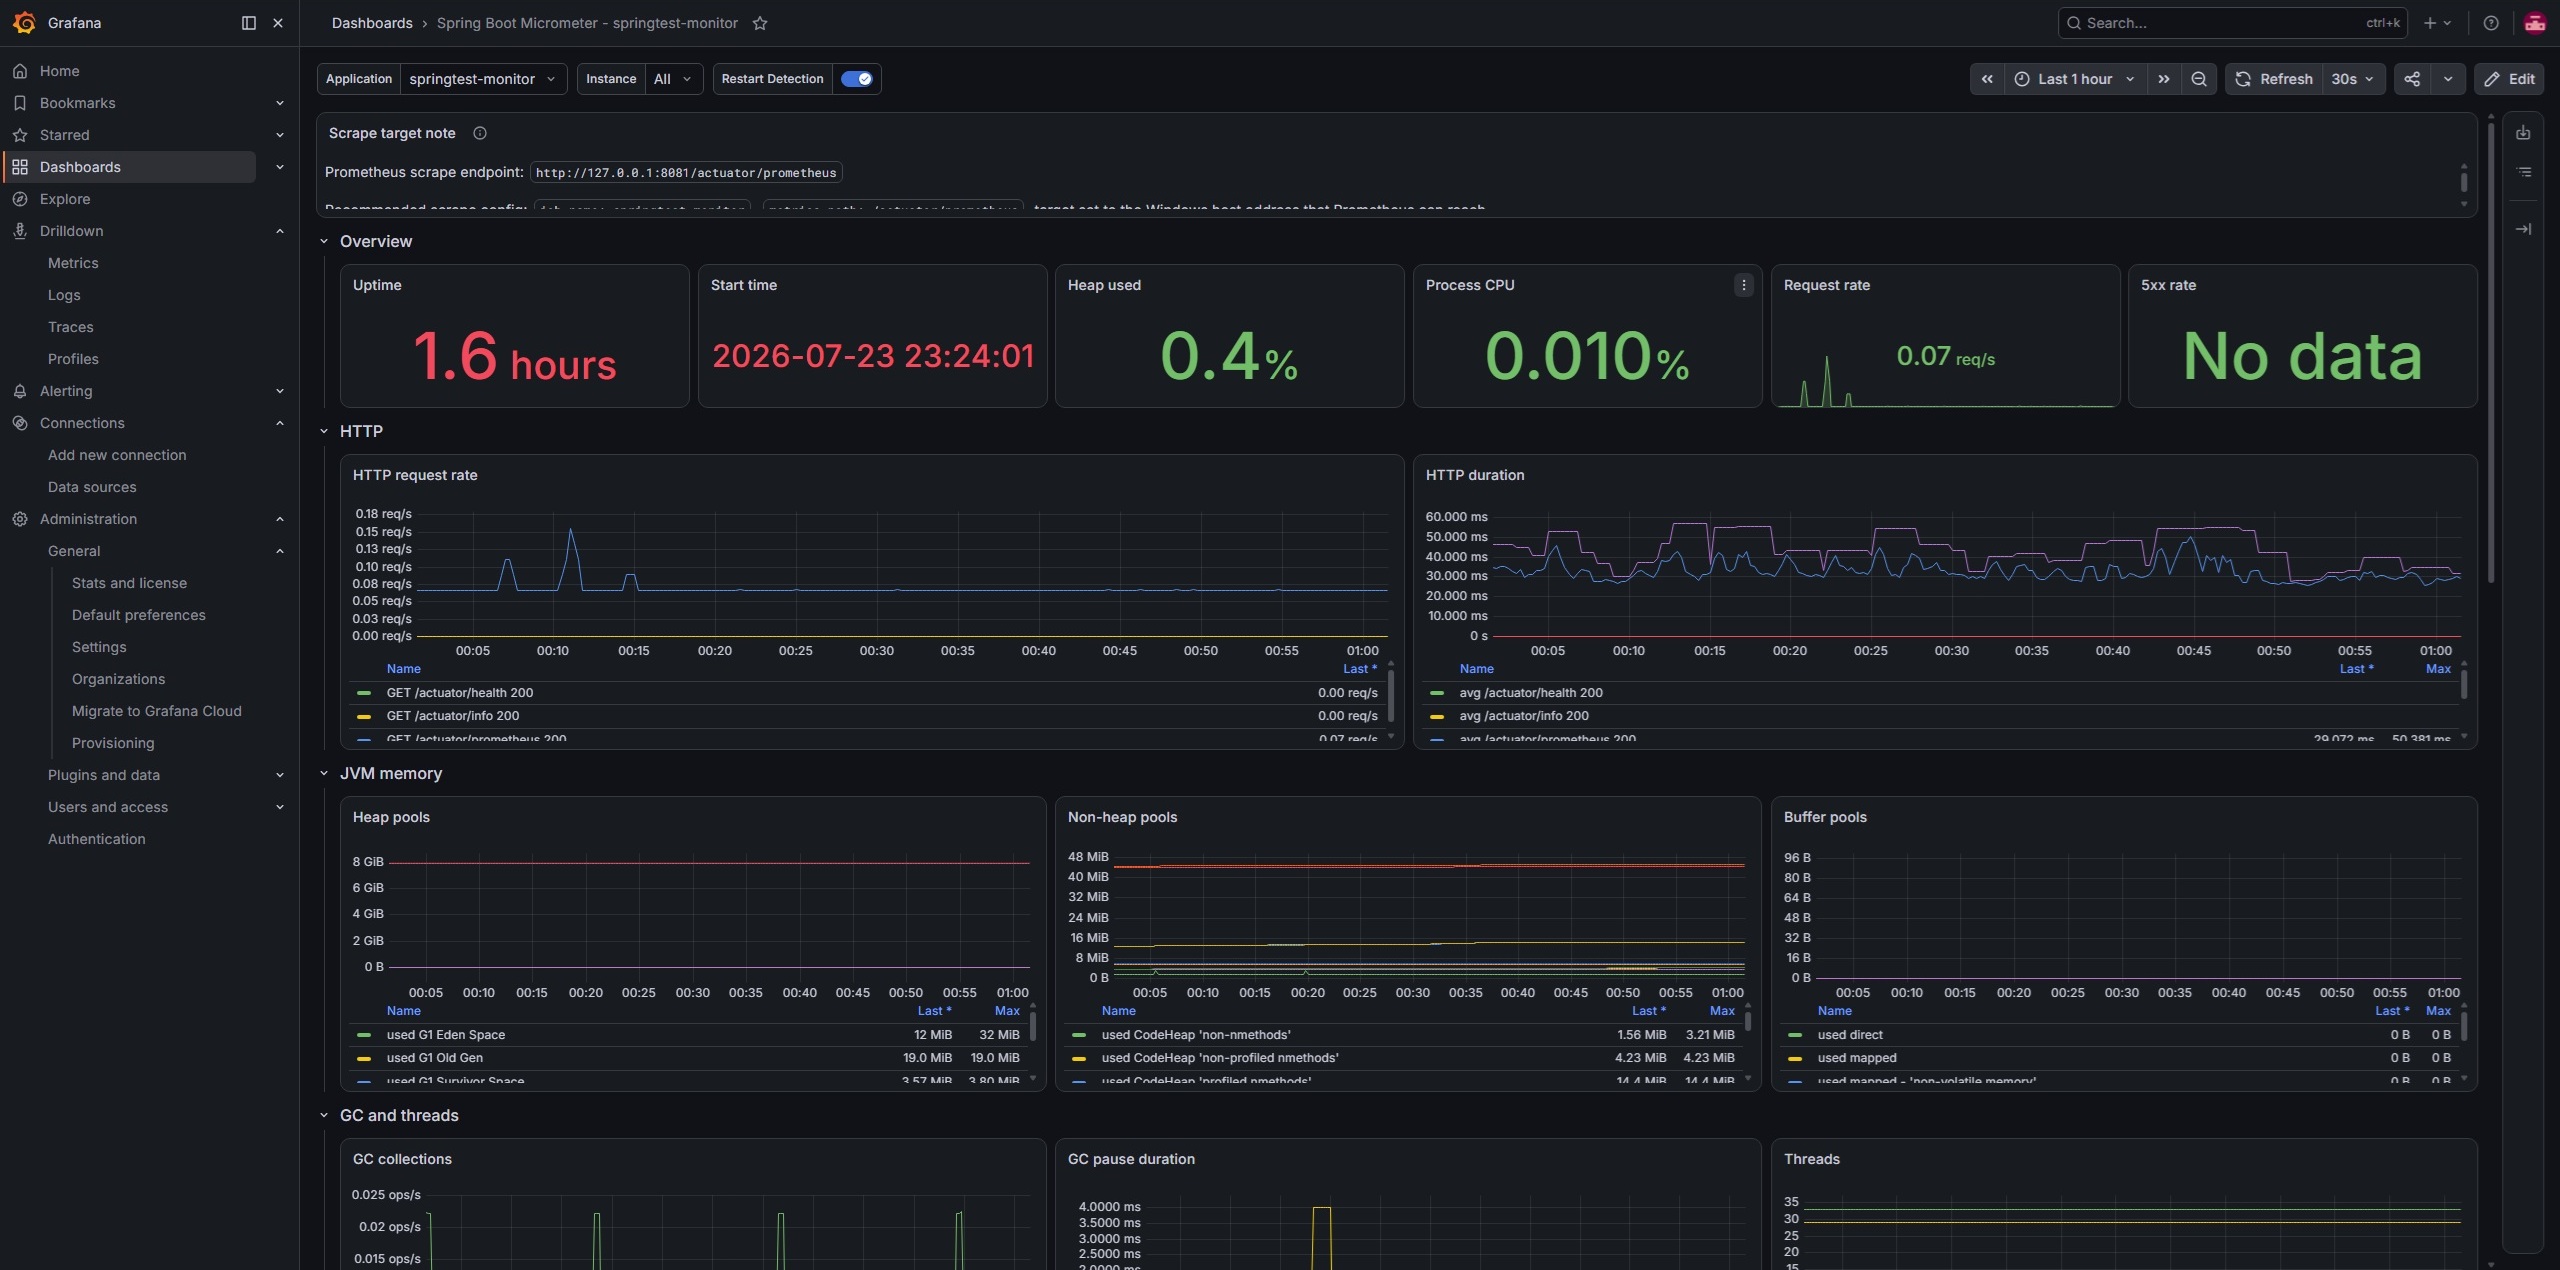
以下是完成設定後,在 Grafana 中查看 Spring Boot Micrometer Dashboard 的實際畫面:
Spring Security 設定
如果 Spring Boot 專案有使用 Spring Security,Prometheus 抓取 /actuator/prometheus 時可能會遇到 401 Unauthorized 或 403 Forbidden。
這時可以在安全性設定中允許 Prometheus endpoint 被存取。以下是 Spring Security 6 的範例設定:
1 | import org.springframework.boot.actuate.autoconfigure.security.servlet.EndpointRequest; |
這段設定只開放 Prometheus scrape endpoint,其他 API 仍然需要通過原本的驗證規則。若是在正式環境中使用,也建議搭配內部網路、防火牆或反向代理限制 Prometheus endpoint 的存取來源。
加入自訂 Metrics
除了 JVM、HTTP request、thread、GC 等 Spring Boot 預設 Metrics,也可以透過 Micrometer 建立自訂指標。
以下範例示範使用 Counter 記錄訂單建立次數:
1 | import io.micrometer.core.instrument.Counter; |
呼叫 createOrder() 後,再開啟 /actuator/prometheus,就可以看到類似以下的 Metrics:
1 | # HELP order_created_total Total number of created orders |
接著可以在 Prometheus 中查詢:
1 | order_created_total |
自訂 Metrics 適合用來記錄與業務邏輯有關的資訊,例如訂單建立數、付款失敗數、任務處理時間或外部 API 呼叫結果。這些資料通常比單純的 JVM 指標更貼近應用程式的實際運作狀態。
常見問題
/actuator/prometheus 回傳 404
通常是因為缺少 micrometer-registry-prometheus 相依套件,或是 management.endpoints.web.exposure.include 沒有包含 prometheus。可以先確認相依套件是否已加入,並重新啟動 Spring Boot。
Prometheus Target 顯示 DOWN
先確認 Spring Boot 應用程式是否正常執行,再檢查 Prometheus 設定中的 targets 與 metrics_path 是否正確。如果 Prometheus 與 Spring Boot 不在同一台機器,targets 不應該使用 localhost。
Prometheus 顯示 401 或 403
如果專案有使用 Spring Security,需要允許 Prometheus 存取 /actuator/prometheus。可以只開放 Prometheus scrape endpoint,避免把所有 Actuator endpoint 都直接公開。
查不到 HTTP request Metrics
http_server_requests_seconds_count 需要應用程式實際收到 HTTP request 後才會出現。如果剛啟動應用程式還沒有任何請求,可以先呼叫幾次 API,再回到 Prometheus 查詢。
小結
透過 Spring Boot Actuator 與 micrometer-registry-prometheus,Spring Boot 應用程式可以很容易地輸出 Prometheus 格式的 Metrics。設定的核心重點有三個:加入 Actuator 與 Prometheus Registry 相依套件、開放 /actuator/prometheus endpoint,並在 Prometheus 中設定正確的 scrape target。
完成這些設定後,Prometheus 就能定期收集 Spring Boot 的 JVM、HTTP request 與自訂 Metrics。後續只要在 Grafana 中使用 Prometheus 作為資料來源,就可以進一步建立應用程式監控 Dashboard,觀察 API 流量、錯誤率、回應時間與資源使用狀況。